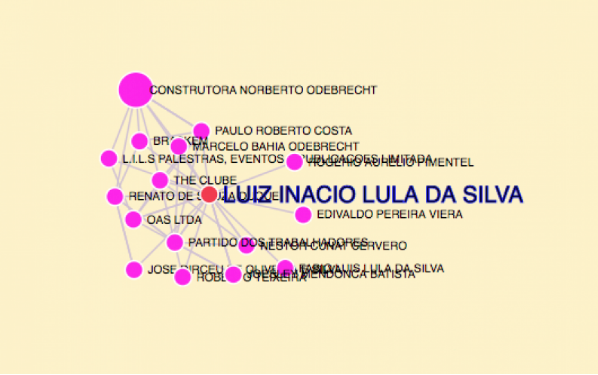
An infographic developed by the Vortex Foundation and the Humanitas360 Institute was created to make it easier to understand the network of criminal connections between politicians, companies and individuals involved in the Operation Lava Jato. The infographic offers a panoramic view of what was disclosed in the data visualisation tool created by both organisations to map the transnational criminal network connected to the Lava Jato scheme, involving hundreds of politicians and companies in myriad countries.
Vortex’s president, Eduardo Salcedo, says that the infographic was created so that even more people can understand the complexity of macro-corruption, as seen in the Lava Jato scheme: “In Brazil, so far, most people have in mind the scandals of politicians involved, so we need to communicate and explain in every possible way the real extent of this issue, be it with a cartoon or with a technical paper.”
Click here to change this text


